|
|
|||||||||
|
|
|
|
|
|
|
|
|||
|
|
|||||||||
|
|
|||||
Software The GeoCube comes with a complete and user-friendly data analysis software package. The GeoCube outputs TC/TRT test data into a file that readily is imported into the included PC-based software. With an on-site laptop, data analysis can be performed immediately after completing the TC/TRT test. The software provides for maximum data flexibility in the data analysis process. It not only calculates soil property results and borehole thermal resistances but also analyzes the data for consistency and quality. The software can recognize significant data aberrations (such as a fluctuating power supply, the presence of groundwater contamination, etc.) and provide this information to the user. In addition, it is a straightforward process to analyze the data over different time frames (10-40 hours, 20-40 hours, etc), which is quite useful when a test specification requires an analysis across time frames. In addition to recognizing any data aberrations, the software automatically selects temperature data sensors (for redundant sensors) based on sloped stability which will save the user time and effort if there is any issue with a sensor or connector during the test. The software outputs a customizable, full professional report that includes multiple color graphs. Project data, user/company information and company logos may be customized for each test project. Industry Standard Output Our TC/TRT Software utilizes line source theory to analyze data and provides results that are compliant to ASHRAE Standard 111-8TRP. Additional Design Software Full loopfield design and CFD piping design software is also available from www.groundloopdesign.com. Ground Loop Design (GLD) is the industry leading commercial loopfield design software. See why this design tool is used in over 62 countries. Training If you are new to the business or a customer that wants to learn how to use the equipment and the software tools that accompany the GeoCube, we offer several training options. Customized training is also available. Here are a couple of the standard courses that are held on a scheduled basis:
Thermal Conductivity
Boot Camp Geothermal Loopfield
and Piping Design |
Specifications:
Benefits: Screenshots:
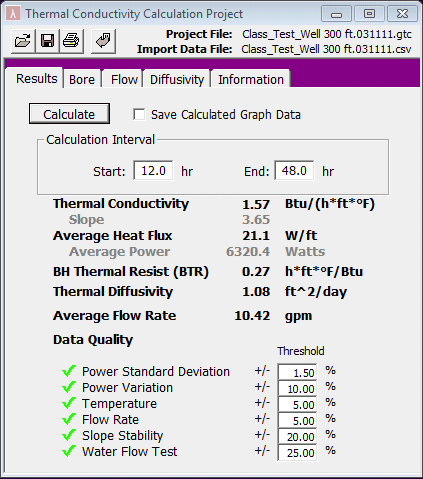
The Results Panel both displays the empirically-derived thermal conductivity and borehole thermal resistance results as well as analyzes the overall data quality based off of user-defined threshold values. Users can easily adjust the calculation interval and determine the optimal time period for a particular test.
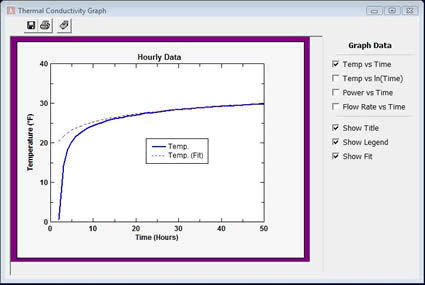
The program automatically graphs the data necessary to determine the conductivity as well as power and flow rates. The program graphs both the raw data and the calculated curves, enabling designers to determine which analysis time period is optimal for each test.
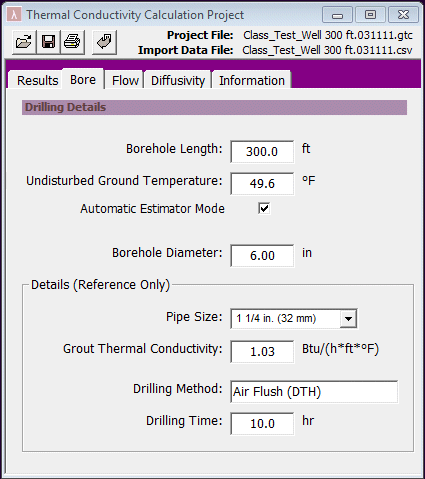
In the bore panel, users enter info related to the borehole and drilling method.
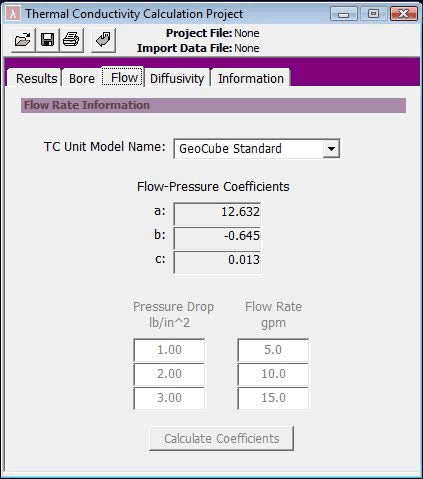
In this panel, users can view the GeoCube's flow-pressure coefficients.
Note: current GeoCubes use pulse flow counters
and no longer need to use this tab. This
tab remains for legacy units that calculated
flow based on pressure differential.
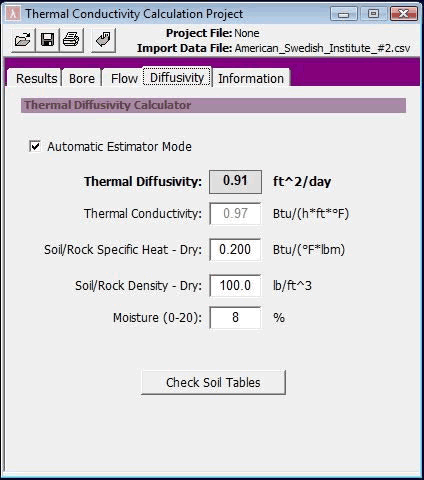
In the diffusivity panel, users can estimate and calculate the thermal diffusivity
based on the availability of drilling data..
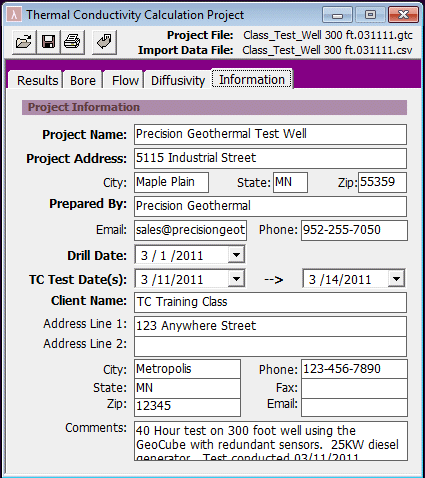
In the Information Panel, users enter project-specific information that is included in the professional reports. Sample Report: Click here to view a sample report. Data Analysis Training Video: (Double click to view)
|
© 2007-2024 Precision Geothermal, LLC |
||
